
The Authentic Advantage
Authentic is a full-service digital agency that unleashes the power of the internet’s digital solutions to create lasting and inclusive change.
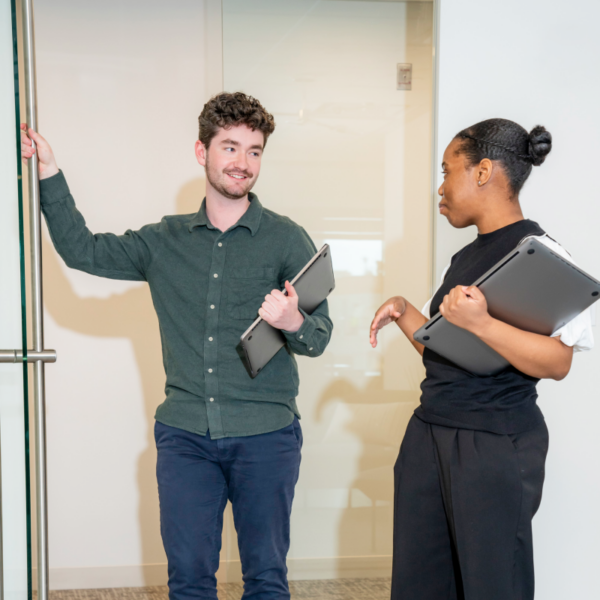
Diverse Culture
We bring diverse voices, ideas, and skills together to deliver award-winning results. Authentic’s digital agency team is empowered to combine their lived experience and whole selves with their expertise to create unique content and digital solutions for our clients.
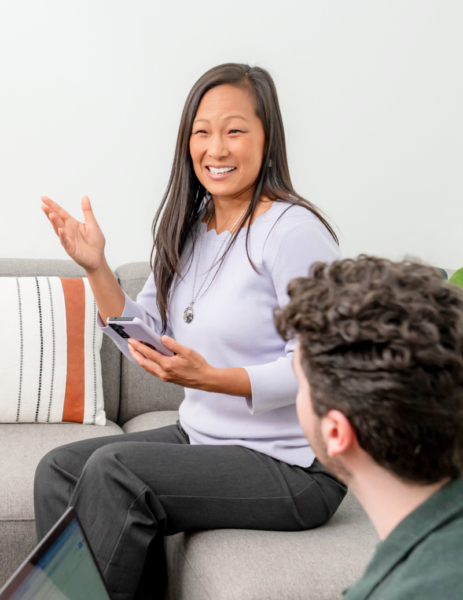
Partnership Approach
Our approach is different, combining passion, purpose, empathy, and skill to create exceptional digital campaigns. Our digital marketing firm’s staff will partner with your non-profit or campaign team to implement thoughtful, data-driven strategies and digital solutions to advance your goals.
Authentic Content
Our approach is all about being Authentic. Get it? We dive deep into our clients’ identities, motivations, journeys, and the causes they care about. Our digital marketing agency’s mission for non-profits and campaigns is to create content that is tailored to their specific needs and goals. See how we’ve brought this approach to life for our clients by checking out our digital marketing case studies.
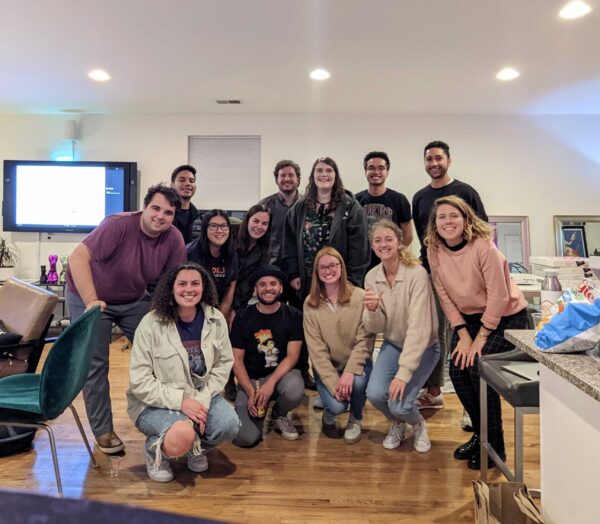
HONEST, HUNGRY, AND CURIOUS
A PROGRESSIVE
ORGANIZATION
Diverse, inclusive & welcoming to all
Race and Ethnicity*
50% of our employees identify as being a part of an underrepresented racial group
22.7% of our employees are Asian/South Asian/Pacific Islander
9.1% of our employees are Bi-racial
9.1% of our employees are Black
4.5% of our employees are White Latino/a/x
4.5% of our employees are Latino/a/x
57.1% of our Leadership are part of an underrepresented racial and/or ethnic group
Gender Expression
54.5% Cis-women
36.4% Cis-men
9.1% Non-binary/Gender non-conforming
57.1% of our Leadership are Cis-women
Sexual Orientation
63.6% of our employees identify as straight
31.8% of our employees identify as LGBTQ+
4.5% of our employees do not wish to disclose
42.9% of our Leadership are LGBTQ+
Disabilities
63.6% of our employees report not having a disability
31.8% of our employees report having a disability
4.5% of our employees do not wish to disclose
57.1% of our Leadership report having a disability
Age
54.5% of our employees are age 26-35
40.9% of our employees are age 18-25
4.5% of employees are age 36-54
Religion
33.3% Christian
33.3% Do not wish to disclose
19.0% Atheist
9.5% None
4.8% Agnostic/Unitarian
Pronouns
54.2% She/Her/Hers
37.5% He/His/Him
8.3% They/Them/Theirs


General Consulting
Digital is the heart and soul of every organization. Emerging technology is changing the way people consume media. We specialize in modernizing campaigns for purpose-driven brands and organizations. Tell us your goals and we’ll be there to ideate and execute alongside you.
Online Fundraising
We’ve raised $1+ billion for progressive campaigns and non-profit organizations with our ethical and effective approach to online fundraising. We combine our storytelling expertise with our personalized approach to maximize energy for your cause.
Digital Paid Media
When you go online, everyone is trying to sell you something. Your feed is full of boring digital ads and subversive social media content. We develop the tool, techniques, and strategies needed to create genuine and authentic ad campaigns that move the needle.
Logo and Branding
It’s more important than ever to show, not tell, people who you are. We design logos, branding, and creative guides that serve as a visual roadmap for your organization. We can also help with merchandising and creative ways to use your logo and branding to further your goals.
Creative Content
Our content team designs compelling and platform-specific assets with your unique audience in mind, delivering a cohesive message that drives engagement. These assets include static graphics, motion graphics, display ads, videos, email graphics, and more.
Mobile Messaging
By harnessing the awesome power of text messaging, we can meet your target audiences where they are. Whatever your goals are, our team will deliver incredible results through our mobile messaging proven process – be it fundraising, engagement, or persuasion.
2024 Shorty Impact Award for
Strategist of the Year
2024 Shorty Impact Award for
Small Agency of the Year
2024 Webby Award for
Social – Public Service & Activism
2024 Pollie Awards for
Digital Advertising – Best Use of Search Engine Marketing
2024 Reed Awards for
Best Fundraising Email Creative/Copy for Primary Campaign – US House/Senate
2024 Reed Awards for
Best Use of Email
2024 Reed Awards for
Best Use of Email for GOTV
2024 Reed Awards for
Best Use of P2P on a Campaign
2024 Reed Awards for
Most Innovative Use of Email
FULL LIST AWARDS

2024 Webby Award
2024 Shorty Impact Award
2024 Shorty Award
2024 Reed Award
2024 Pollie Awards
2024 Media All-Stars
2024 CampaignTech Award
2023 Reed Awards- Campaigns & Elections
2023 Pollie Awards – AAPC

2023 Digital Strategy Awards- Center for Digital Strategy
2022 Reed Awards – Campaigns & Elections
2022 Pollie Awards – AAPC

2022 CampaignTech Awards – Campaigns & Elections
2021 Reed Awards – Campaigns & Elections

2021 Pollie Awards – AAPC
2021 CampaignTech Awards – Campaigns & Elections
2020 Rising Star Award – AAPC
2020 Reed Awards – Campaigns & Elections
2020 Pollie Awards – AAPC
2019 Reed Awards – Campaigns & Elections
2019 Pollie Awards – AAPC
Yard/Outdoor Sign
Website – U.S. House of Representatives – Democrat
Website – For Local/Municipal/Mayoral – Small Budget Campaign
Voter ID Program
Strategist of the Year
Storytelling
Social – Public Service & Activism
Social Movement Campaign – Bronze
Social Activism
Small Agency of the Year
Single Post or Activation
Product or Service of the Year
Presidential Primary
Pioneering Use of Digital
Overall — Candidate Division — Best Fundraising Campaign
Most Innovative Use of Email
Media All-Stars
Mass Transit/Bus Sign
Loren Merchan
Internet Advertising — Presidential Primary
Internet Advertising — For U.S. House of Representatives
Internet Advertising — Bilingual/ Multilingual/Foreign Language
Internet Advertising – Best Use of Targeting
Internet Advertising — Best Use of Search Engine Marketing
Innovation in Media Buying (Democratic)
Innovation in Fundraising
Innovation in Artificial Intelligence
Guerrilla Marketing – Gold
Governor & Politics – Silver
Government & Politics
Fundraising Gift With Donation
Fundraising — Best Use of Website/ Donation Page
For U.S. House of Representatives
Earned Media – Gold
Digital Creative – Full Set
Digital Campaign Leader of the Year
Digital Agency of the Year
Digital Advertising – Best Use of Search Engine Marketing
Digital Ad Creative of the Year
Company of the Year
Collateral — Yard/Outdoor Sign
Collateral — Mass Transit/Bus Sign
Bilingual/ Multilingual/Foreign Language
Best Website for Statewide – Democratic
Best Website for Primary Campaign – US House/Senate
Best Website for County, Local, or Judicial – Democratic
Best Voter Registration Campaign
Best Video – Political Campaigns
Best Use of Website/Donation Page
Best Use of Social Media – Digital Acquisition
Best Use of Social Media
Best Use of Search Engine Marketing
Best Use of Search Engine Marketing
Best Use of Programmatic Advertising
Best Use of Personalization in Fundraising (Democratic)
Best Use of Personalization in Fundraising
Best Use of P2P on a Campaign
Best Use of Online Targeting for Special Election
Best Use of Online Targeting for Senate
Best Use of Online Targeting for Primary – House/Senate – Democratic
Best Use of Online Targeting for Presidential Primary Campaign
Best Use of Online Targeting for Gubernatorial
Best Use of Online Targeting
Best Use of New Technology
Best Use of Humor
Best Use of Fundraising – Super PAC
Best Use of Email Marketing
Best Use of Email for GOTV
Best Use of Email
Best Use of Data Analytics/Machine Learning (Non-Fundraising)
Best Use of Data Analytics/Machine Learning in Online Fundraising (Democratic)
Best Use of Data Analytics/Machine Learning in Field Program (Democratic)
Best Use of Data Analytics/Machine Learning in Field Program
Best Use of Data
Best Use of a Social Platform
Best Use of a Social Platform
Best Use of a Meme
Best Use of a Landing Page for Digital Fundraising
Best Use of 501(c)(4)
Best Rapid Response Merchandise
Best Piece of Campaign Merchandise (Democratic)
Best Online Video – Snackable
Best Online Advertising Creative
Best New or Unusual Tactic in Paid Media
Best New Firm
Best New AI Tool
Best Logo – Democrat
Best Logo & Branding – Candidate Campaign (Democratic)
Best Landing Page
Best Landing Page
Best GOTV Execution
Best GOTV Campaign to Mobilize Diverse Communities
Best Fundraising Technology
Best Fundraising Email Creative for Presidential Primary Campaign
Best Fundraising Email Creative for Mayoral Campaign
Best Fundraising Email Creative for Mayoral
Best Fundraising Email Creative/Copy for Statewide Campaign – Non-Federal
Best Fundraising Email Creative/Copy for Special Election
Best Fundraising Email Creative/Copy for Primary Campaign – US House/Senate
Best Fundraising Email Creative/Copy for Mayoral Campaign
Best Fundraising Email Creative/Copy for Gubernatorial Campaign
Best Fundraising Email Creative
Best Fundraising Campaign – Democrat
Best Fundraising Campaign
Best End-of-Quarter Fundraising Email
Best Employer: Work-From-Home Transition (Democratic)
Best Employer: Professional Development Initiative
Best Employer – Democratic
Best Email Subject Line
Best Email Creative for US Senate
Best Email Campaign – Organizations
Best Email Action Alert
Best Digital Campaign – Democrat
Best Creative Campaign – Political Campaign
Best Campaign Meme (Democratic)
Best Campaign Gif
Best Application of Testing in an Email Program
Best Application of AI to Optimize Targeting
AI Pioneer of the Year
40/40
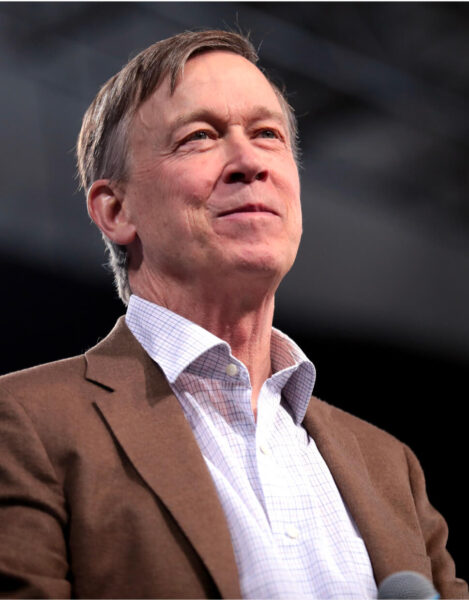
“Authentic did a masterful job capturing our voice and raising tens of millions of dollars online. They were great partners and a key reason we flipped Colorado’s seat blue.”
John Hickenlooper
Elected Senator 2020

“Authentic did a phenomenal job supporting our re-election campaign. They modernized our brand and website and helped us develop a successful online fundraising program that was rooted in my voice. The persuasion program Authentic developed was innovative and a great compliment to our TV, mail, and field programs.”
Lauren Underwood
U.S. House
“Authentic’s team is professional, creative, and committed to developing digital programs that are unique to each client. They have been great partners in the fight to win and maintain Democratic control of the Senate.”
Karen Hancox
Senate Majority PAC
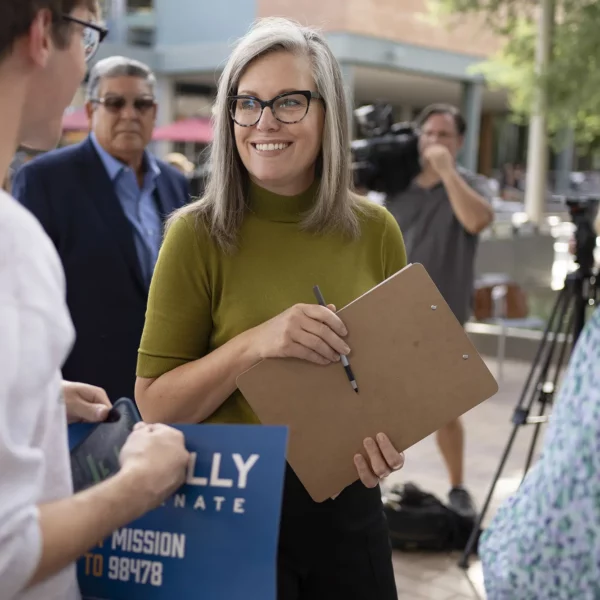
“Thanks to Authentic, we were able to build an historic campaign in Arizona that relied on grassroots support to propel us to victory. They were the lifeblood of our digital team, and I recommend them wholeheartedly.”
Katie Hobbs
Governor
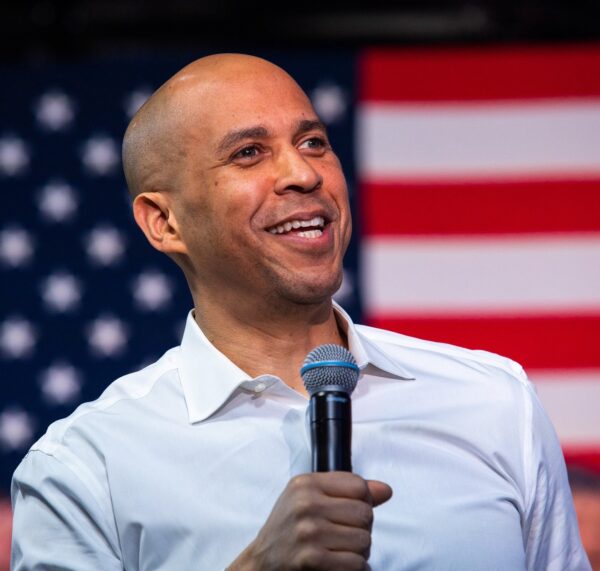
“The Authentic team delivered the necessary resources we needed to carry our message forward. Their hard work has given us the success and momentum we need to continue the work in the Senate.”
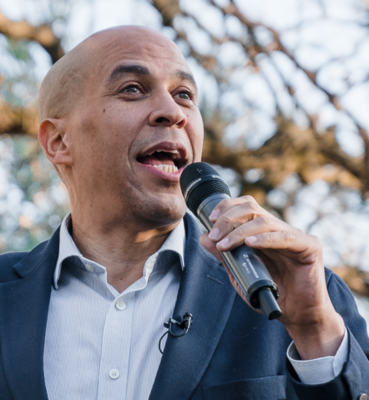
Cory Booker
U.S. Senate
“When I launched my special election, our team needed to bring on a digital partner fast and Authentic crushed it from day one. They put together strategic persuasion plans that worked in tandem with our TV and mail vendors. This team knows how to get the job done and was an incredible part of our campaign’s success.”
Pat Ryan
U.S. House

“I am thrilled with the success we saw in our online fundraising thanks to the team at Authentic. They did a phenomenal job top-to-bottom, and I recommend them for your campaign.”
Tina Kotek
Governor
“Thanks to Authentic, our online metrics are way up across the board. Our supporters are more engaged than ever and I love knowing how hard the Authentic team is working to prioritize our organizational goals and brand identity. It’s been night and day partnering with Authentic and I highly recommend hiring them.”
Will Dempster
National Immigration Law Center
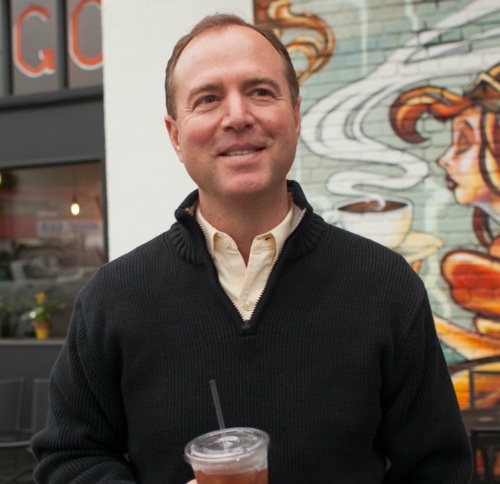
“Authentic has moved quickly, worked creatively, and communicated effectively in a way that allowed me to connect with supporters across California and the country. They have helped me build a digital program that has exceeded all my expectations, while remaining, well, authentic to my voice.”
Adam Schiff
U.S. House
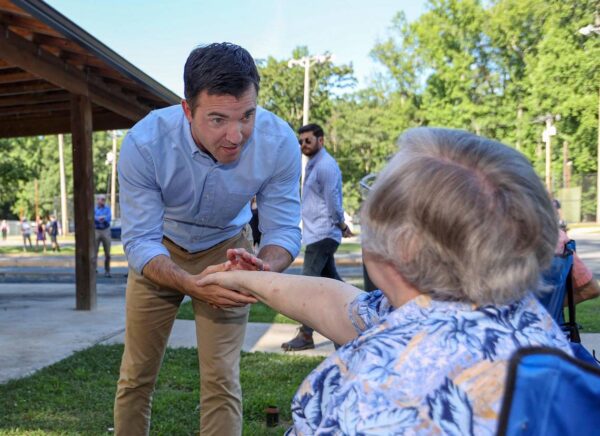
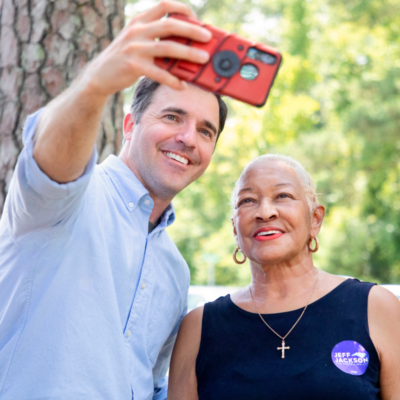
We’ve had a great partnership with Authentic now across two campaigns, and I highly recommend them to anybody who wants to win. Their team is dedicated and hard working. They take the time to understand their client’s voice and priorities. They are one of the best digital agencies out there and I continue to work with them to this day.
Jeff Jackson
US House
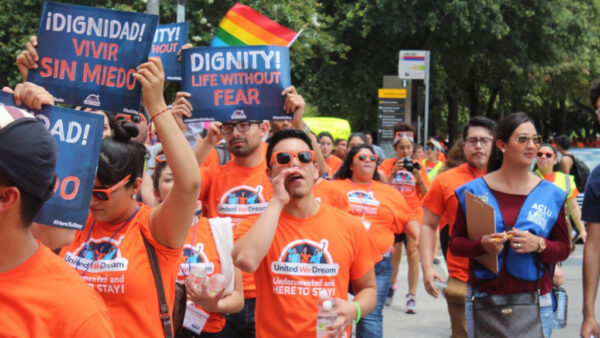
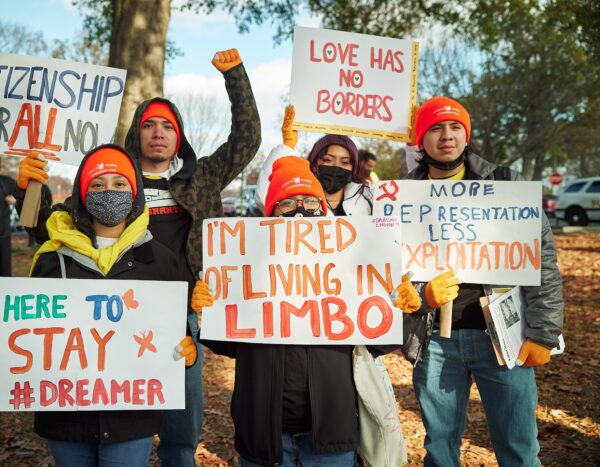
For years, Authentic has helped us amplify our message online and introduce more supporters to our work uplifting immigrant communities. They have been great partners in helping us understand how we can maximize grassroots fundraising and digital advertising — all while staying true to the voice, goals, and values of our organization. Because of Authentic, we’ve been able to capitalize on rapid response moments. Their experience in managing and tracking multiple entities has been a great benefit to our work
Carolina Bortolleto
Deputy Digital Director, United We Dream
“Authentic was a pleasure to work with on our website redesign project. They were responsive, attentive, and understood our needs and vision to modernize our website to better support our members. Thanks to their expertise, our new website is user-friendly, and reflects our organization’s mission and core values. We couldn’t be happier with the final result and have already received positive feedback from our members. We highly recommend Authentic for any website design needs.”
Becky Galvez
President, EO Chicago
Looking to Make a Difference? Join Our Team.
Learn more about open positions and the benefits of being an Authentic employee.